Benchmark area:
Fingerprint Indexing

|
This benchmark area contains fingerprint indexing benchmarks. Fingerprint indexing consists in comparing a query fingerprint against a large database and to select the most similar candidates. Algorithms submitted to these benchmarks are required to search a set of query fingerprints over a given fingerprint database, producing, for each query, a candidate list containing the most similar database fingerprints sorted by similarity.
|
Benchmarks
Currently, the following benchmarks are available:
- FIDX-TEST: A simple dataset useful to test algorithm compliancy
with the testing protocol
(results obtained on this benchmark are only visible in the participant
private area and cannot be published).
- FIDX-10K-1.0: The benchmark consists of ten
thousand fingerprints to be indexed and one hundred fingerprints to be searched.
Each searched fingerprint has one mate in the indexed ones. Images
were acquired in operational conditions using high-quality optical scanners.
- FIDX-50K-1.0: The benchmark consists of fifty
thousand fingerprints to be indexed and five hundred fingerprints to be
searched. Each searched fingerprint has one mate in the indexed ones. Images
were acquired in operational conditions using high-quality optical scanners.
The table below reports the main characteristics of each benchmark:
|
Benchmark |
Scanner Type |
Resolution |
Image Size |
Indexed Images |
Searched Images |
|
FIDX-TEST |
Optical |
500 dpi |
400x500 |
100 |
10 |
|
FIDX-10K-1.0 |
Optical |
500 dpi |
400x500 |
10000 |
100 |
|
FIDX-50K-1.0 |
Optical |
500 dpi |
400x500 |
50000 |
500 |
Some sample images with the same format used in the benchmarks of this area are
available in the download page.
The following sections report the testing protocol and the performance indicators
common to all benchmarks in this area.
Protocol
Each participant is required to submit, for each algorithm,
one executable named Index.exe in the form of Win32 console application.
The executable will take the input from command-line arguments and will save
the output to file into a specific format.
Constraints
The submitted algorithms are executed on an Intel(R) Xeon(R) E5410 CPU @ 2.33GHz
with 4GB of RAM. During test execution the following constraints will be enforced:
|
Benchmark |
Maximum test execution time |
|
FIDX-TEST |
2 minutes |
|
FIDX-10K-1.0 |
120 minutes |
|
FIDX-50K-1.0 |
600 minutes |
Each algorithm that violates one of the above constraints results in an execution
failure and no performance indicators are provided.
The following time breaks are enforced between two consecutive submissions to the
same benchmark by the same participant.
| Benchmark |
Minimum break |
|
FIDX-TEST
|
12 hour(s)
|
|
FIDX-10K-1.0
|
30 day(s)
|
|
FIDX-50K-1.0
|
30 day(s)
|
Performance Evaluation
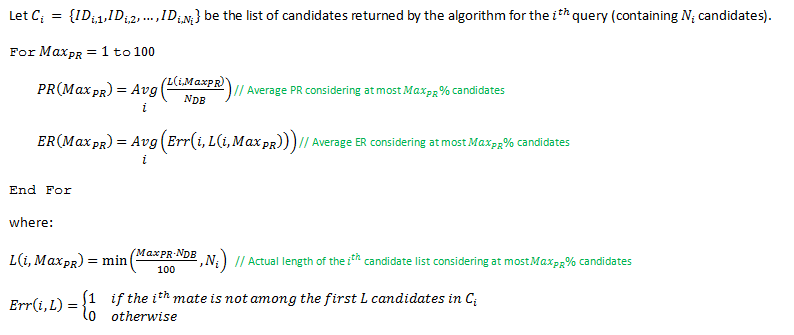
The performance of fingerprint indexing approaches is typically evaluated by reporting the trade-off between Error Rate (ER) and Penetration Rate (PR). The error rate is defined as the percentage of searched fingerprints that are not found; the penetration rate is the portion of database that the system has to search on the average (corresponding to the average length of the candidate lists). In this benchmark area, the ER/PR trade-off depends on a parameter (MaxPR) controlling the maximum portion of database to be considered: the ER/PR is calculated for MaxPR values in the range [1%,…,100%]. Each value of MaxPR corresponds to a maximum number of candidates MaxC=MaxPR*NDB/100, where NDB is the total number of database fingerprints: if a candidate list is longer than MaxC, only the first MaxC candidates are considered to calculate the corresponding PR and ER values. The following pseudo-code describes the procedure in detail. Note that the length of the candidate list
produced by an algorithm can be different for each query fingerprint: for
instance an algorithm, based on its internal scores or probabilities, may decide
to produce a very short candidate list for some queries and longer candidate
lists for others. A shorter candidate list will results in lower PR values, but may produce more errors, hence this aspect should be carefully considered by algorithm developers
(see also [1] [2]).

For each algorithm, the following accuracy performance indicators
are calculated according to the above procedure, and reported:
- ER100 (the lowest PR for ER≤1%)
- ER1000 (the lowest PR for ER≤0.1%)
- Graph of the trade-off between ER and PR
Besides the above performance indicators, another retrieval scenario (called Incremental Search),
where an ideal matching algorithm is used to stop the search as soon as the
right candidate is retrieved, is considered. In such a scenario there are no
retrieval errors since, in the worst case, the search can be extended to the
whole database, and the average penetration rate is reported as a single
performance indicator:
- IS (the average PR in the Incremental Search scenario)
Finally, for each algorithm, the following efficiency performance indicators
are reported:
- Average enrollment time
- Average search time
- Total execution time
Bibliography
[1] R. Cappelli, M. Ferrara and D. Maltoni, "Fingerprint Indexing based on
Minutia Cylinder-Code", IEEE Transactions on Pattern Analysis Machine
Intelligence, vol.33, no.5, pp.1051-1057, May 2011.
[2] R. Cappelli, M. Ferrara and D. Maio, "Candidate List Reduction based on the
Analysis of Fingerprint Indexing Scores", IEEE Transactions on Information
Forensics and Security, vol.6, no.3, pp.1160-1164, September 2011.
|